HTML5's Canvas element can be daunting to get started with. I bought a book to learn about it, and have been hiding it on my shelf for a year or so (luckily it's quite small and easily hideable).
A few months ago, I was at a coding challenge event where my team was charged with creating a fractal generator in a few hours. One of our teammates piped up, saying Canvas might be a good way to make the required drawings. Without much time to absorb the terror of such a thought, we launched into an adventure that turned out to be... FUN.
This episode led to a late-night adventure that reminded me of drawing with spirographs. If you don't know what spirographs are, they are a set of plastic toy gears and toothed rulers with holes for a colored pen to poke through. Placing them onto paper and running the gears along sets of stationary teeth produces repeating looped patterns as the pen is guided by the revolving gear holes.
I'd like to share this journey with you in the hopes that you might be inspired to make some fun drawings of your own.
Roadmap
Here are the steps we'll take in part 1:
- Learn to draw on Canvas
- Learn some facts about triangles
- Figure out how to draw an equilateral triangle in Canvas
Part 2 is where we'll learn to draw our triangle at any angle. That's when things will really start to get interesting!
There will be a little math to work out, but don't worry, we'll break it all down on the way. Let's get started!
The HTML
The HTML for this is dead simple. Simply declare a Canvas element, along with its pixel dimensions, like so:
<canvas id="spirograph" height="600" width ="900"></canvas>
So your complete page could look like this:
<!DOCTYPE html>
<html>
    <head>
        <title>Spirograph</title>
        <style type="text/css">body{text-align: center;}</style>
    </head>
    <body>
        <canvas id="spirograph" height="600" width ="900"></canvas>
        <script type="text/javascript" src="spirograph.js"></script>
    </body>
</html>
The rest of our work will be done in JavaScript, in a file you can see linked there at the bottom, "spirograph.js". So let's create that file, and get started drawing.
How Canvas Works
To hook into the Canvas element to manipulate it, we have to select it and grab a reference to its context object using getContext(), and pass in a special string '2d':
var canvas = document.getElementById( 'spirograph' )
var context = canvas.getContext( '2d' )
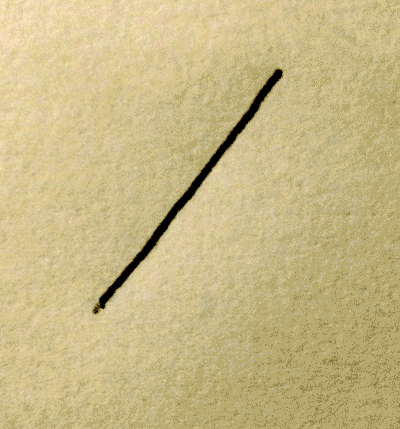
Context's methods allow us to create and draw paths. You could think of drawing on Canvas like using a pen on a piece of paper. To pick up the pen, you call:
context.beginPath()
To place the pen somewhere, you can use:
context.moveTo( x , y )
Then to draw a line from where your pen is to another point:
context.lineTo( x , y )
You can use moveTo again to pick the pen up and move it elsewhere:
context.moveTo( x , y )
Canvas listens to these instructions as you give them, and remembers them without drawing them right away. Once they are complete, you can call:
context.stroke()
and Canvas goes and actually draws what you described. Finally, to complete the path and put the pen down, you call:
context.closePath()
When drawing with a real pen and paper, you would use your eye to instruct your hand where to put the pen down and pull it across the paper, and where to pick it up again. Canvas only understands coordinates, though, so we'll have to feed it horizontal (x) and vertical (y) pixel positions.
The coordinates (0,0) are at the farthest upper-left corner of the canvas, and the x positions get higher as you move right, while y positions get higher as you move down. So for example if you have a 100px by 100px canvas, the coordinates (100,100) are at the farthest right and bottom corner of the canvas.
I like to use arrays to hold coordinates: [ x , y ]. This means we only need one variable to hold them instead of two, and we can use Function.prototype.apply() to pass the array to Canvas' methods, since apply turns arrays into arguments to pass into whatever function it is called on.
Convenience Functions
Let's create some helper functions based on this idea. These will make our code a little cleaner later on.
var moveTo = function( coordinates ) {
  context.moveTo.apply( context, coordinates )
}

var lineTo = function( coordinates ) {
  context.lineTo.apply( context, coordinates )
}
In case the benefit isn't visible right away, I'll point out where it helps us later on when we come to it.
Since we've done that, why not go ahead and simplify the syntax of the other methods we'll need?
var beginPath = context.beginPath.bind( context )
var stroke = context.stroke.bind( context )
var closePath = context.closePath.bind( context )
var clearCanvas = context.clearRect.bind(
                    context, 0, 0, canvas.width, canvas.height )
In case you're not familiar with Function.prototype.bind, it returns an instance of the function you call it which is bound to the object you give it as an argument. In other words, now instead of having to call
context.beginPath()
we only need to call
beginPath()
because bind has now packaged up context with our new standalone beginPath. Naturally if there were other Canvas elements on the page (each with their own contexts), this approach might lead to confusion, because you'd have to have another naming system for each context (beginPath2, stroke2...).
Let's Draw!
Starting at the end and working backwards, suppose we have a function called drawEquilateralTriangle we can already use. What do we want it to know before it starts drawing? Let's say we want it to accept the coordinates of a location on the Canvas, and center the triangle on that location. Additionally, it could take an angle of orientation, and the lenth of a side. If we simplify the function name, we have this signature:
drawTriangle( location, length, orientation )
Now let's figure out how to implement it.
Drawing with Coordinates (It's All Triangles)
As previously discussed, we are drawing on a grid. This means that if we only ever want to draw horizontal or vertical lines, our job is easy. That's what a grid is. However, if we want to include any lines that tilt (and we do!), we need to put a little more thought into it.
Suppose we have a straight, tilted line drawn. Now suppose we draw a horizontal line that forms an acute angle with our tilted line. From the other end of the tilted line we draw a vertical line towards our horizontal line until the two meet at a right angle. We have just drawn a right triangle, with our original line as the hypotenuse. Going a bit further, consider that any tilted line we can think of can be described as the hypotenuse of a right triangle in this way.
With this key piece of knowledge, we can use Pythagoras' famous theorem to describe any straight line we wish to draw on a grid:
a2 + b2 = c2, where a and b are the lengths of the horizontal and vertical sides, and c is the length of the hypotenuse.
More Fun Facts About Triangles
While we're looking a triangle facts, let's bring some others to mind. You'll soon see why!
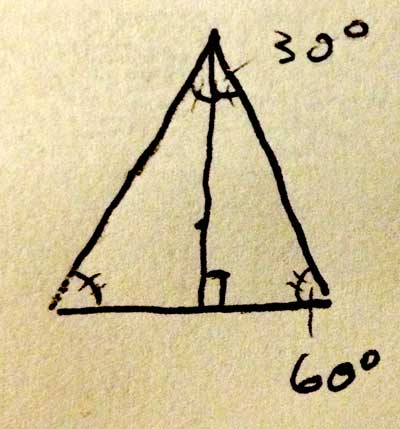
- All three angles of any triangle always add up to 180°.
- Each angle of an equilateral triangle is 60° (180/3 = 60).
- 30-60-90 triangles (referring to the degrees of its angles) are special, and the relationship of the lengths of each side are known, such that if the shortest side is 1 unit, the longest side is 2 units, and the remaining side is the square root of 3 units (or 31/2 units). Here is some more information, with a handy diagram.
Plan the Path for an Equilateral Triangle
With some of those facts under our belts, let's look at our current probem. Consider an equilateral triangle with an angle pointing straight up, and a side laying flat beneath it, like one of the pyramids of Egypt.
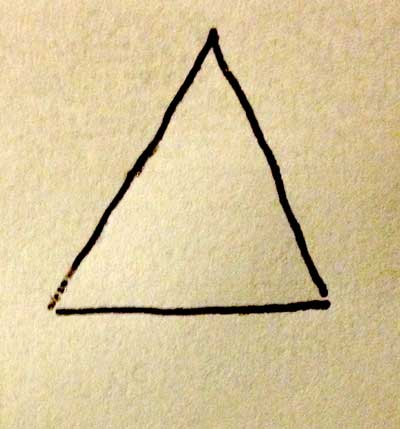
Because the size is arbitrary, we'll say the length of each side is length. If we start at the middle of this triangle, how would we figure out how to get to one of the corners, where we wish to begin drawing?
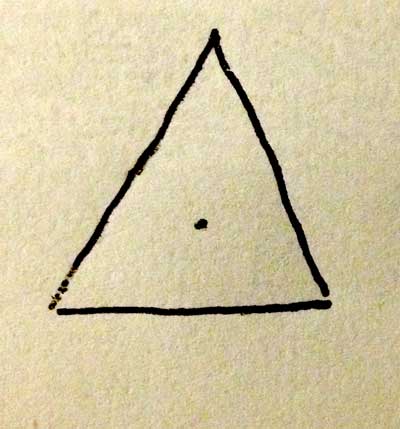
If we draw a perpendicular line through our center point, one end will meet the top point exactly, and the other will divide the base in half. Our new vertical line cuts the equilateral triangle into two right triangles.
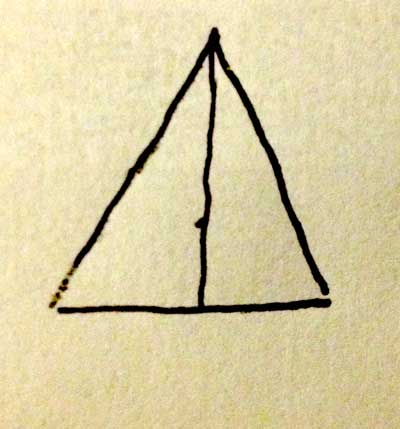
Let's think about what just happened here. If each corner of an equilateral triangle is 60°, and we just cut one of them in half, the resulting twin triangles must be 30-60-90 triangles.
This fact will help us get from the left-most corner up to the top, but for now, let's just keep this in mind and move on.
Let's make another 30-60-90 Triangle
So this is going to start looking like origami, but our next line will give us a clear path to the left-most corner. Draw a line from the lower-left hand corner of our equilateral triangle to the center point, creating a smaller triangle below our new line. This triangle is the key to reaching our first point, if we can determine the length of its vertical and horizontal sides. Because we're dividing the left corner (which is 60°) exactly in half, and right-most angle of this tiny triangle is 90°, we know it is also a 30-60-90 triangle.
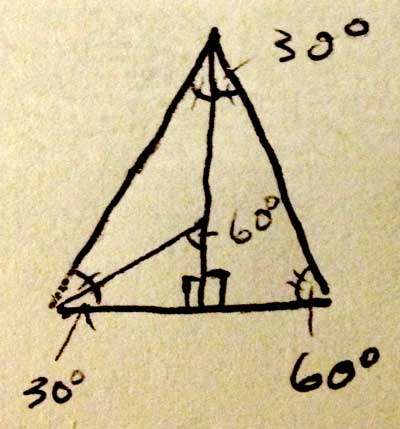
We know that the bottom side's length, which is half of length, i.e. length / 2. We also know that the proportions of the triangle are such that if the vertical side is 1, the bottom side is the Math.sqrt( 3 ). If we then take that proportionality and divide both of those sides by Math.sqrt( 3 ), we see that when the bottom side is 1, the vertical side is 1 / Math.sqrt( 3 ), which is a lot more useful to know. We can just multiply that expression by the length of the horizontal side to get the length of the vertical side.
Getting to our first corner
Based on what we just figured out, let's do that multiplication:
( length / 2 ) * ( 1 / Math.sqrt( 3 ) )
This yeilds:
length / ( 2 * Math.sqrt( 3 ) )
for the vertical side, so we know that if we begin at an origin point of [ x , y ], the left-most corner's x value will be at
x - ( length / 2 )
while the y value will be at
y + ( length / ( 2 * Math.sqrt( 3 ) ) )
Why are we subtracting the horizontal length from x while we add the vertical length to y? Because as mentioned above, Canvas' ys get bigger as we move down, and xs get bigger when we move right. Since we want to go down and left, we want to add to our current y value and subtract from our current x value.
If we package this into an array, we get:
[ x - ( length / 2 ), y + ( length / ( 2 * Math.sqrt( 3 ) ) ) ]
That is an ugly expression! Luckily, though, JavaScript will sort it all out for us.
Getting to our second corner
Now we'll use one of our other 30-60-90 triangles (the twins we got from dividing our equilateral in half) to get to the top point. We know the top is horizontally at the center of the triangle, so our x coordinate will be simply x. Because of the 30-60-90 proportions, we know that the distance from the base of the equilateral triangle to the top-most corner will be Math.sqrt( 3 ) multiplied by its shortest side, or
Math.sqrt( 3 ) * ( length / 2 )
However, to get there from our origin y coordinate, we'll need to subtract the distance from the origin to the base, which we already know from our work with the tiny 30-60-90 triangle:
( length / 2 ) * ( 1 / Math.sqrt( 3 ) )
Putting that together, the equilateral triangle's top corner is at
[ x , y - ( ( Math.sqrt( 3 ) * ( length / 2 ) ) - ( ( length / 2 ) * ( 1 / Math.sqrt( 3 ) ) ) ) ]
Again let's not dwell too much on this expression, and just trust our math. Lucky for us, JavaScript loves to work things like these out!
Our Final Corner
These final coordinates are actually going to be pretty easy, because we've essentially worked them out already. The y value will be the same as the first corner we visited, and the x will be the same distance from center, but the opposite direction, so we'll just need to add instead of subtract from our origin. So we get:
[ x + ( length / 2 ), y + ( length / ( 2 * Math.sqrt( 3 ) ) ) ]
Are We Drawing Yet?
Yes! Now that we've worked out the coordinates we'll need, the function drawTriangle will pretty much write itself. If you recall, we said drawTriangle would accept a location, side length, and an orientation. Until we work out how to deal with orientation, we'll ignore that parameter for now. Without further ado:
function drawTriangle( location, length, orientation ) {
    var canvas = document.getElementById( 'spirograph' ),
        context = canvas.getContext( '2d' )
        moveTo = function( coordinates ) { context.moveTo.apply( context, coordinates ) },
        lineTo = function( coordinates ) { context.lineTo.apply( context, coordinates ) },
        beginPath = context.beginPath.bind( context ),
        stroke = context.stroke.bind( context ),
        closePath = context.closePath.bind( context ),
        clearCanvas = context.clearRect.bind( context, 0, 0, canvas.width, canvas.height ),
        x = location[0],
        y = location[1],
        firstCorner = [ x - ( length / 2 ), y + ( length / ( 2 * Math.sqrt( 3 ) ) ) ],
        secondCorner = [ x , y - ( ( Math.sqrt( 3 ) * ( length / 2 ) ) - ( ( length / 2 ) * ( 1 / Math.sqrt( 3 ) ) ) ) ],
        thirdCorner = [ x + ( length / 2 ), y + ( length / ( 2 * Math.sqrt( 3 ) ) ) ];

    // Draw it!
    beginPath()
    moveTo( firstCorner )
    lineTo( secondCorner )
    lineTo( thirdCorner )
    lineTo( firstCorner )
    stroke()
    closePath()
}
Once all the setup is done, it's pretty simple stuff. Now we just need to call drawTriangle from a function we assign to window.onload. Here's my version of spirograph.js:
function drawTriangle( location, length, orientation ) {
    var canvas = document.getElementById( 'spirograph' ),
        context = canvas.getContext( '2d' )
        moveTo = function( coordinates ) {
            context.moveTo.apply( context, coordinates )
        },
        lineTo = function( coordinates ) {
            context.lineTo.apply( context, coordinates )
        },
        beginPath = context.beginPath.bind( context ),
        stroke = context.stroke.bind( context ),
        closePath = context.closePath.bind( context ),
        clearCanvas = context.clearRect.bind(
                    context, 0, 0, canvas.width, canvas.height ),
        x = location[0],
        y = location[1],
        firstCorner = [ x - ( length / 2 ), y + ( length / ( 2 * Math.sqrt( 3 ) ) ) ],
        secondCorner = [ x , y - ( ( Math.sqrt( 3 ) * ( length / 2 ) ) - ( ( length / 2 ) * ( 1 / Math.sqrt( 3 ) ) ) ) ],
        thirdCorner = [ x + ( length / 2 ), y + ( length / ( 2 * Math.sqrt( 3 ) ) ) ];

    // Draw it!
    beginPath()
    moveTo( firstCorner )
    lineTo( secondCorner )
    lineTo( thirdCorner )
    lineTo( firstCorner )
    stroke()
    closePath()
}

window.onload = function() {
    drawTriangle([450,300], 200)
}
If you paste the html at the top of this post into a document called index.html, and the above into a document called spirograph.js (in the same folder), you should see a triangle when you open index.html in a browser.
Playing Around
Now that we have a function that will draw a triangle, why not play with it? That's the whole point, right? For instance, let's draw a few more:
window.onload = function() {
    drawTriangle([450,300], 100)
    drawTriangle([450,300], 200)
    drawTriangle([450,300], 300)
    drawTriangle([450,300], 400)
    drawTriangle([450,300], 500)
}
Or try:
window.onload = function() {
    for (var i = 1; i < 500; i += 10) {
        drawTriangle([450,300], i)
    }
}
Or:
window.onload = function() {
    for (var i = 1; i < 500; i += 10) {
        drawTriangle([i,300], i)
    }
}
One more:
window.onload = function() {
    for (var i = 1; i < 1000; i += 10) {
        drawTriangle([900 - i,i], i)
    }
}
Try some variations of your own!
Conclusion
In this article we went over the basics of how to work with HTML5's Canvas element. We worked some moderately tricky math to draw an equilateral triangle over a grid, and then we made some fun triangle-based art with loops. In the next post, we'll take this function even further to draw an equilateral triangle at any angle we specify, which can take our triangle art to a whole new level!